
You are probably familiar with the acronym ABC which is short for “always be closing.” This is a mantra preached by many in the sales world.
Lucky for me, I’m not a salesperson.
So I like to live by a different philosophy – ABT.
In this case, “always be testing.”
Look, I am a huge fan of data and analytics. Particularly when it comes to social media analytics.
There is so much that can learned by knowing what does or doesn’t work.
But did you know that you can use Twitter to A/B, split test or even multivariate test?
Not only just sharing different variations, but the ability to easily view your tweet analytics side-by-side in Microsoft Excel.
It’s true and today I am going to reveal how I use Twitter Analytics and Excel to do perform your own tweet analysis.
Here's some of what we'll cover:
 You could decide to test the section heading against the blog post title as well as the statistic.
 If you aren't using hashtags, you might be missing out. But you won't really know unless you do your own hashtag analysis.
 Other people, myself included typically like to share the different variations again and again over a period of time.
Going this route allows me to do a few things:
Other people, myself included typically like to share the different variations again and again over a period of time.
Going this route allows me to do a few things:
 In just a few short steps, you will be able to upload your list of tweets to test:
 To make the copying/pasting easier using the Excel file you created above, you will want to use this formula in cell D2:
 If you want to post the tweet right away, you can hover over the tweet and click “share now.” This will send your post to your Twitter account immediately.
 Should you want to simply upload a CSV to populate your tweets automatically, there is a way to do it.
 Notice the pending, active, and completed columns that each have groups of updates within them.
It makes it very easy to stay organized.
And this comes in very handy if you are going to want to post these updates again and again in order to get more exposure and data. Additionally, it allows you to keep these updates separate from any other updates you have grouped in Bulkly which will allow you to set more or less frequent sending to Buffer. When you are finished running your Twitter test, there won’t be any need to sift through hundreds of scheduled updates to remove only a few – you just have to delete the group or drag it over to the "Completed" column.
One thing to note about Bulkly is that it currently uses your posting schedule as it is setup in Buffer. This means that when a tweet is sent to Buffer, it will be added to the next available spot in your Buffer queue.
Before we get started, we’ll need to tweak the Excel file to work with Bulkly. If you aren’t interested in messing with a CSV, you can easily create your tweets online instead. Click here to see how.
In order to group your tweets in the CSV, you will need to format it like this:
Notice the pending, active, and completed columns that each have groups of updates within them.
It makes it very easy to stay organized.
And this comes in very handy if you are going to want to post these updates again and again in order to get more exposure and data. Additionally, it allows you to keep these updates separate from any other updates you have grouped in Bulkly which will allow you to set more or less frequent sending to Buffer. When you are finished running your Twitter test, there won’t be any need to sift through hundreds of scheduled updates to remove only a few – you just have to delete the group or drag it over to the "Completed" column.
One thing to note about Bulkly is that it currently uses your posting schedule as it is setup in Buffer. This means that when a tweet is sent to Buffer, it will be added to the next available spot in your Buffer queue.
Before we get started, we’ll need to tweak the Excel file to work with Bulkly. If you aren’t interested in messing with a CSV, you can easily create your tweets online instead. Click here to see how.
In order to group your tweets in the CSV, you will need to format it like this:
 Browse for your file. Once uploaded you will be directed to your “Pending” queue. This will show the posts you have uploaded, but not actually scheduled.
From here you can edit and of the items you uploaded. When you are ready, you’ll need to select the Twitter account(s) you want to send these updates to as well as how often you want to send them to Buffer. Click on the “Activate” button to move everything in this group to the “Active” queue.
Browse for your file. Once uploaded you will be directed to your “Pending” queue. This will show the posts you have uploaded, but not actually scheduled.
From here you can edit and of the items you uploaded. When you are ready, you’ll need to select the Twitter account(s) you want to send these updates to as well as how often you want to send them to Buffer. Click on the “Activate” button to move everything in this group to the “Active” queue.
 Within a few hours your tweets will be dripped into your selected Twitter accounts at the intervals you selected.
 Once you have entered your tweets, be sure to activate your group to start sending to Buffer.
 In your tweets tab, by default you will see your last 28 days of tweet activities. This date range can be changed to show a maximum of 90 days’ worth of data starting from when you first setup your Twitter Analytics account.
This page is full of key data for your tweets. Among the data displayed are impressions, engagement rate, link clicks, retweets, likes, and replies. All of this data is shown in the right sidebar.
The meat of the page displays your most recent tweets of the date range. It will show you the tweet, impressions, engagements, and engagement rate. Twitter defines engagement rate as:
In your tweets tab, by default you will see your last 28 days of tweet activities. This date range can be changed to show a maximum of 90 days’ worth of data starting from when you first setup your Twitter Analytics account.
This page is full of key data for your tweets. Among the data displayed are impressions, engagement rate, link clicks, retweets, likes, and replies. All of this data is shown in the right sidebar.
The meat of the page displays your most recent tweets of the date range. It will show you the tweet, impressions, engagements, and engagement rate. Twitter defines engagement rate as:
 As I mentioned, you can export up to 90 days of data at a time. So if your Twitter testing has lasted longer than 3 months, you can set the date range to be sure you download all the data. You will just need to combine the data into a single Excel file to get the whole picture of your tests.
After you have downloaded all your data, it’s time to move on to the fun part – manipulating the data to see what does or doesn’t work.
As I mentioned, you can export up to 90 days of data at a time. So if your Twitter testing has lasted longer than 3 months, you can set the date range to be sure you download all the data. You will just need to combine the data into a single Excel file to get the whole picture of your tests.
After you have downloaded all your data, it’s time to move on to the fun part – manipulating the data to see what does or doesn’t work.
 Next, you will be asked to find the file you want to import. In this case, you will need to find your exported Twitter file. After, you select the file location a wizard will load (nope, it’s not Gandalf).
Step 1 of the wizard is asking you what is the data type for this file. You will need to have the “deliminated” radio button selected and then click “next.”
Next, you will be asked to find the file you want to import. In this case, you will need to find your exported Twitter file. After, you select the file location a wizard will load (nope, it’s not Gandalf).
Step 1 of the wizard is asking you what is the data type for this file. You will need to have the “deliminated” radio button selected and then click “next.”
 For step 2 of the wizard, you need to indicate the delimiters of the file. In this case, the file is delineated by commas. Uncheck all boxes and have the box selected for comma. You will know it is working when your rows of data become organized into columns. Click next.
 The final step is to tell Excel where you want to insert this data. You should be placing it in an empty sheet so you can click in cell A1 and then click “ok.”
 All of the data from your Twitter export will be added to the spreadsheet. If you exported multiple date ranges from Twitter, just repeat this same process. However, you can insert the data at the end of the data you already imported. Just be sure to remove the row containing the header info for each set of data you import.
Once all your data has been imported, rename your Excel tab as “Raw Twitter Data” and save as an Excel file (not a CSV).
If you want to try building this out yourself, or are just interested as to what is happening in the file keep reading. Not interested in this kind of stuff, I won’t judge – you can click here to get to the part of reading the data.
All of the data from your Twitter export will be added to the spreadsheet. If you exported multiple date ranges from Twitter, just repeat this same process. However, you can insert the data at the end of the data you already imported. Just be sure to remove the row containing the header info for each set of data you import.
Once all your data has been imported, rename your Excel tab as “Raw Twitter Data” and save as an Excel file (not a CSV).
If you want to try building this out yourself, or are just interested as to what is happening in the file keep reading. Not interested in this kind of stuff, I won’t judge – you can click here to get to the part of reading the data.
 This will magically create normal looking dates for your tweets. For example:
 This will now count all the cells with data in a row with data for this field.
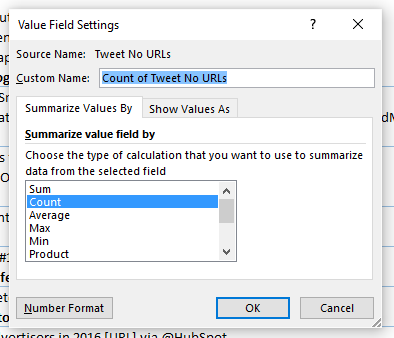
Following the same process, you need to change the “Value Field Settings” for the “Engagement Rate” to summarize the value field by “Average.” This will show an average engagement for each tweet.
Another thing you might want to do for your “Engagement Rate” column is to change the format of the column to show as a percentage. To do this, highlight the whole column and then right-click and select “format cells.” Then click on “percentage” and change the decimals to two places and click “ok.”
This will now count all the cells with data in a row with data for this field.
Following the same process, you need to change the “Value Field Settings” for the “Engagement Rate” to summarize the value field by “Average.” This will show an average engagement for each tweet.
Another thing you might want to do for your “Engagement Rate” column is to change the format of the column to show as a percentage. To do this, highlight the whole column and then right-click and select “format cells.” Then click on “percentage” and change the decimals to two places and click “ok.”
 Your filtered results will show you the URL(s) tweeted for that domain and the different tweets that were sent linking to that URL.
Viewing the columns to the right, you will be able to see the different type of engagement that specific tweet text generated. You will need to determine what your main KPI is.
Typically, I put more weight onto the average engagement rate in that I am looking to create social updates that drive more overall engagement.
Your filtered results will show you the URL(s) tweeted for that domain and the different tweets that were sent linking to that URL.
Viewing the columns to the right, you will be able to see the different type of engagement that specific tweet text generated. You will need to determine what your main KPI is.
Typically, I put more weight onto the average engagement rate in that I am looking to create social updates that drive more overall engagement.
 On occasion, I am more interested in driving clicks to a URL so I will look at the URL clicks. However, instead of showing the sum (total) clicks to a URL, I change the column to show the average clicks for the social media update.
 The beauty of this report is that it is pretty flexible. You can tweak it to show the data you want. You will notice that Twitter exports quite a bit of data which will allow you to manipulate it to your needs.
Some additional data you might be interested for your tweets are:
The beauty of this report is that it is pretty flexible. You can tweak it to show the data you want. You will notice that Twitter exports quite a bit of data which will allow you to manipulate it to your needs.
Some additional data you might be interested for your tweets are:
 Once you plug in your numbers, this nifty tool will tell you if your results are statistically significant.
Even if your results are not statistically significant, chances are you can tell when something is a dud or not.
For most, the way you will be able to get to statistical significance is to be sure to post your tweets multiple times to increase the overall impressions of each.
Typically, my tests are not necessarily time sensitive in that the majority of my posts are evergreen in nature. This makes it easy to run my test tweets for an extended time.
Everyone’s situation will be different in regards to how long or how many times you should tweet your tests. I would say a good start is at least 10 times or so. However, it might be best to spot check your Twitter Analytics every few days to see how things are going.
Once you plug in your numbers, this nifty tool will tell you if your results are statistically significant.
Even if your results are not statistically significant, chances are you can tell when something is a dud or not.
For most, the way you will be able to get to statistical significance is to be sure to post your tweets multiple times to increase the overall impressions of each.
Typically, my tests are not necessarily time sensitive in that the majority of my posts are evergreen in nature. This makes it easy to run my test tweets for an extended time.
Everyone’s situation will be different in regards to how long or how many times you should tweet your tests. I would say a good start is at least 10 times or so. However, it might be best to spot check your Twitter Analytics every few days to see how things are going.
- Why you should test using your Twitter tweets
- How to setup your Twitter Analytics account
- Different ways to create and schedule your tweets for testing
- Accessing and analyzing your tweet analytics with Microsoft Excel
Download My Ready-To-Go Excel File - Click here to download my Microsoft Excel file so you can easily view your tweet analytics.
Different Types of Testing
The two most common types of testing are A/B testing and multivariate testing. With A/B (sometimes referred to as split-testing) you are running a test of two items. In this case, some possibilities for an A/B test are:- Changing the CTA of the tweet (using "Please RT" against "Share this", etc)
- Test a tweet that uses an attached image against one that doesn't use an image
- Perform a hashtag analysis where you compare the effectiveness of one hashtag against another
21 Ideas for Evergreen Social Media Content Updates https://t.co/JJJ5Pud4nl pic.twitter.com/p1LeKOewQv
— Chris Makara 👽 (@ChrisMakara) March 14, 2016
In multivariate testing you are changing two or more things in the variation against the control. A few examples are:21 Ideas For Evergreen Social Media Content Updates https://t.co/FRVaIsPe0y
— Chris Makara 👽 (@ChrisMakara) March 5, 2016
- Impact of the CTA by different hashtags and attached images
- Changing of CTA's impacted differently with the placement of the URL in the tweet
- Test the effect of engagement rate of using the blog post title against a section title of your blog post
85% Think That a Mobile Site Must Be as Good, if Not Better Than, a Desktop Site - https://t.co/tUVrtV24rB
— Chris Makara 👽 (@ChrisMakara) March 14, 2016
The important thing about running A/B or multivariate tests is to know what you are testing for. Are you interested in engagement rate, number of URL clicks, likes, retweets, etc. Knowing this up front can help you create better tests.85% Think That a #Mobile Site Must Be as Good, if Not Better Than, a #Desktop Site https://t.co/sgJWuE881f pic.twitter.com/EtMqsxwJEo
— Chris Makara 👽 (@ChrisMakara) March 16, 2016
Why You Should Test Using Your Twitter Tweets
There are many different ways you can test. For example, there are WordPress plugins that can switch out your blog titles. But, what if your site doesn't get a ton of traffic? You will be waiting forever to get results of what does or doesn't work. Other options for testing include using paid social ads. While this does work and can get you results rather quickly, maybe you don't have a budget to do this? So what's the free solution? Use your Twitter account. Of course, if you want to use this method you should have a decent size following or a very engaged user base.Before You Can A/B Test With Twitter, You’ll Need to Setup Your Analytics Account
When you create a Twitter account, you will also be able to get access to your Twitter analytics. It’s a pretty easy process to get setup. If you already have Twitter Analytics up and running, you can go ahead and skip to the next section. So if you don’t already have a Twitter account (I won’t judge you), go ahead and create your account. Once your account is created, you have “turn on” Twitter Analytics. Simply go to Twitter Analytics and login. Once logged in, you will see a button to click in order to setup your Twitter Analytics account. It’s important to setup your Twitter Analytics account as soon as you can since data won’t be tracking until you have activated your account. Depending on if you are using a new account or already had one setup, your date range of data will vary for your tweet analytics.Creating and Scheduling Your Tweets
In order to run any sort of test, you will need at least two things (versions) you will want to test. This can be something as simple as changing the CTA in a tweet from “click here” to “read now”. Or you can have two entirely different texts to test buy spotify plays. Additionally, you can test tweets with or without images.Test Tweets from Existing Content
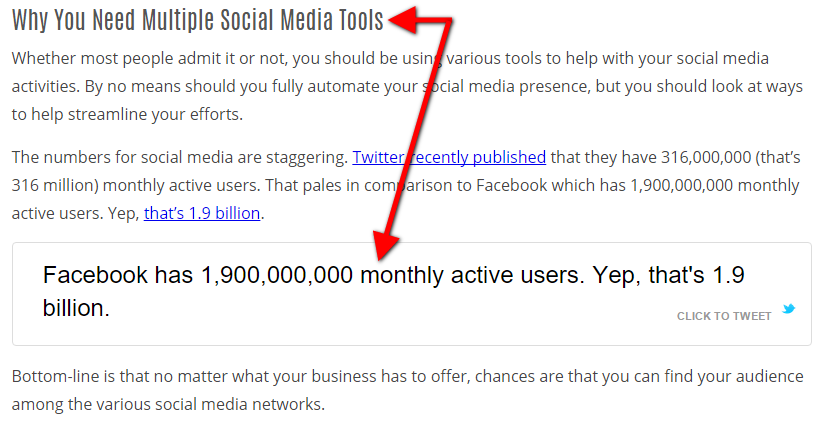
For me, the easiest way to create tweets come from work that I have already done. Simply put, I scan the blog post I will be sharing to see what I would like to test. This is one of the ways I go about creating evergreen social media updates – see #4. Basically, you can look for:- Section headings
- Stats
- Quotes
- Tips/Tricks
“Facebook has 1,900,000,000 monthly active users. Yep, that’s 1.9 billion.”
You could decide to test the section heading against the blog post title as well as the statistic.
Test Tweets With or Without Images
Another option for testing could be to test whether the use of an image with the tweet effects engagement rates. To do this, you would have a tweet with an image, then another tweet exactly the same but without the image. Additionally, you could test tweets that both had the same image, but different text. And when it comes to images, here's a great tool that offers countless social media image templates to use.Test Blog Post Titles With Tweets
I’m sure as you were pounding away at the keyboard on your latest blog post you more than likely came up with a handful of blog post titles. (No blog yet? Read this to start a blog). There are some you probably thought were garbage, while others made it difficult to decide if it should be the one you ultimately roll with when you publish your post. Why not take your different titles and use them as the text of the tweet? You can then see which one(s) get you the most engagement. Who knows, it could be the one you least expected…but you’ll never know until you test it with your social audience.Test The Impact of Hashtags on Your Tweets
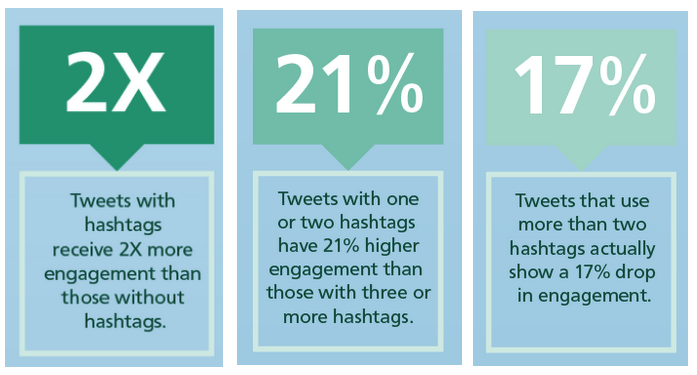
Are you using hashtags in your tweets? If not, you could potentially be missing out on more engagement. According to this Buffer post, tweets that use hashtags can get double the engagement rate. But be cautious if you plan on using more than two hashtags as engagement can drop.
If you aren't using hashtags, you might be missing out. But you won't really know unless you do your own hashtag analysis.
Create a File With Your Tweets to Test
No matter which route you decide you want to test in Twitter, I recommend creating a file to save all your variations of Tweets. This will make it easier for you when you want to share the tweets. Here is what you will need to do:- Create an Excel file (or Google Sheet) with three columns
- In Column A, enter the text of your tweet
- For Column B, enter the URL of the blog post
- If you are going to use an image, note the location of it in Column C
Scheduling Your Tweets to be Tested
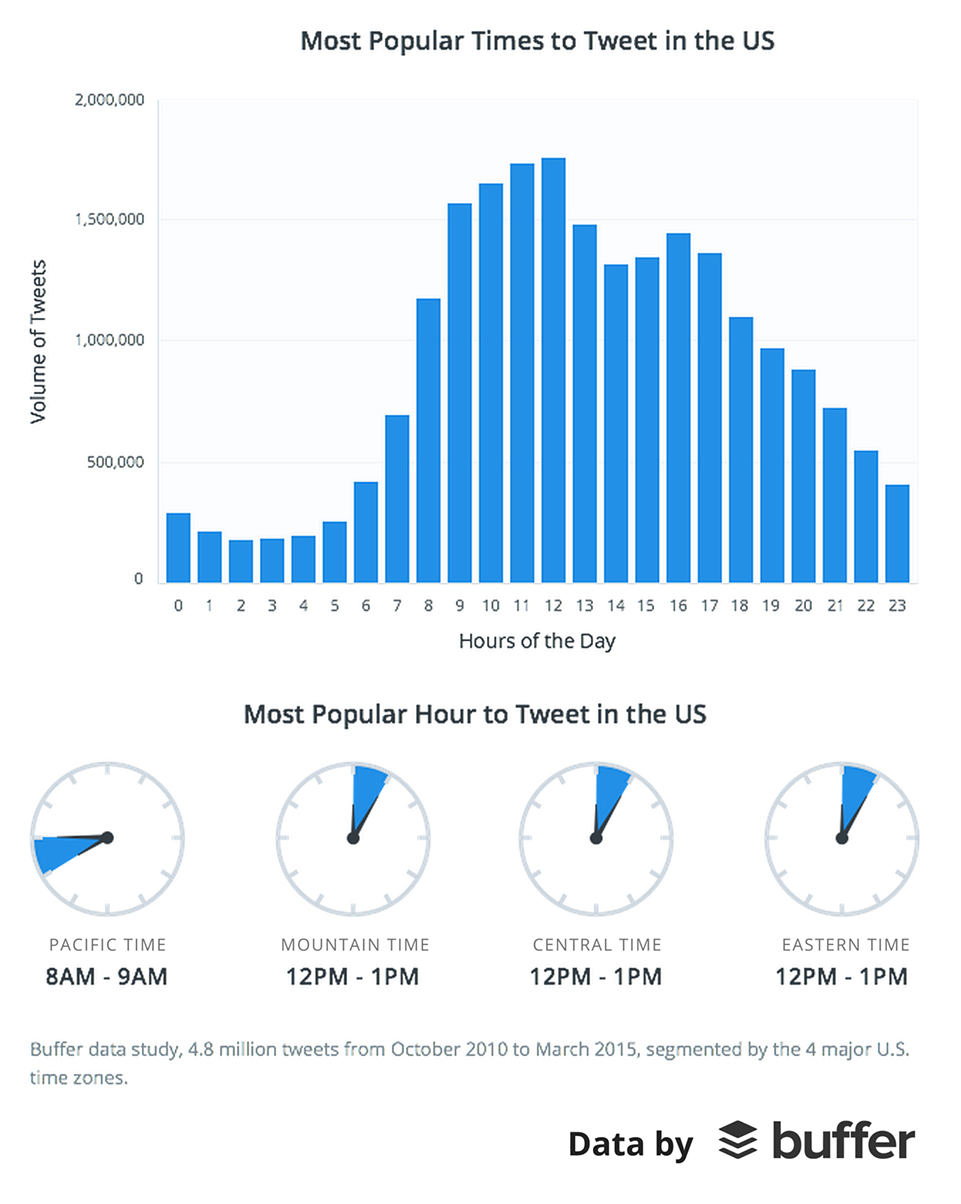
Depending on how you want to test may determine the approach you take to schedule your tweets. Some people prefer to post both variations at the same time and base their results on just those two tweets. You can even identify the best times to tweet for your followers, and choose to post during those times.
Other people, myself included typically like to share the different variations again and again over a period of time.
Going this route allows me to do a few things:
- Get a larger sample size of people who viewed the tweet
- Opportunity to show different variations across different days/hours/timezones
Post the Tweets Manually
This approach would work best if you plan on doing a one-time test. Meaning that you want to simply post the tweet one time and see what happens. Simply login to your Twitter account and post your tweet from the Excel file you created. Once posted you can check the tweet stats on Twitter for that single tweet. Now, unless you have a huge Twitter audience you probably won’t get too much insight from posting a single tweet. As you know, only a fraction of your audience will actually see your tweet. Therefore, I recommend posting the same tweet multiple times to maximize exposure and to get enough data to make an informed decision. This can easily be done through scheduling your social media posts.Use Hootsuite to A/B Test Your Tweets
One of the largest social media scheduling tools is Hootsuite. This tool will allow you to do many things on Twitter including social media monitoring, team collaboration, and the ability to schedule tweets. Remember the Excel file you created with your tweets? With some slight modification you can use it to upload your tweets to Hootsuite. Here’s what you need to do. The format that Hootsuite will accept is a 3 column CSV file (a CSV is a comma separated file you can make in Excel). These columns are:- Date and time – What day and time will the tweet in this row be published
- Your message – This is the content of the tweet. It should be at most 117 characters
- URL (optional) – While it is optional to use in the eyes of Hootsuite, we will need to use one so that we can more accurately monitor the data later. This will take about 23 characters when the URL is shortened
- Date and time
- Your message
- URL
- 2/11/2016 7:30:00 AM
- 2/11/2016 8:00:00 AM
- 2/11/2016 8:30:00 AM
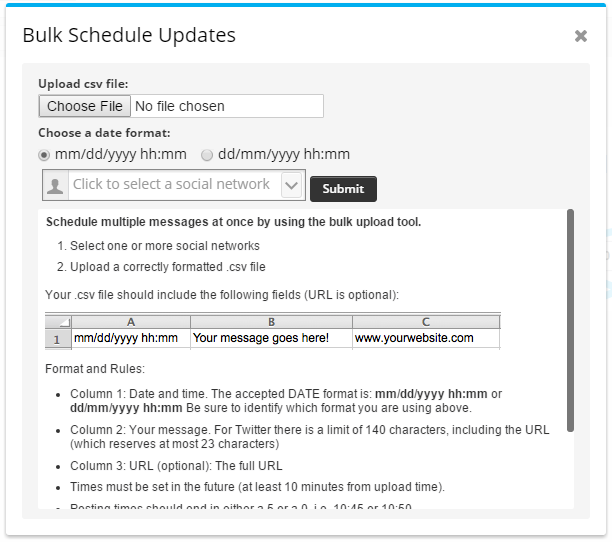
In just a few short steps, you will be able to upload your list of tweets to test:
- Simply click the “Choose File” button and browse your computer where you saved your CSV file.
- If you used the date format I mentioned above, just be sure to click the radio button for “mm/dd/yyyy hh:mm.”
- Next you will need to select the social network (Twitter account) you want to schedule these tweets for.
- The final step is click the “submit” button.
- Hootsuite only allows you to upload and schedule one version of an update. Meaning that you can’t typically upload duplicate tweets. You will have to re-add them later once they have been published.
- There is not an easy way to recycle your tweets to use again and again automatically if you want to post the tweets multiple times. You will have to re-add your CSV file once all scheduled tweets from it have been sent.
- If you want to attach an image to your tweet, you will need to manually click on the tweet to edit it and upload your image.
A/B Test Tweets With Buffer
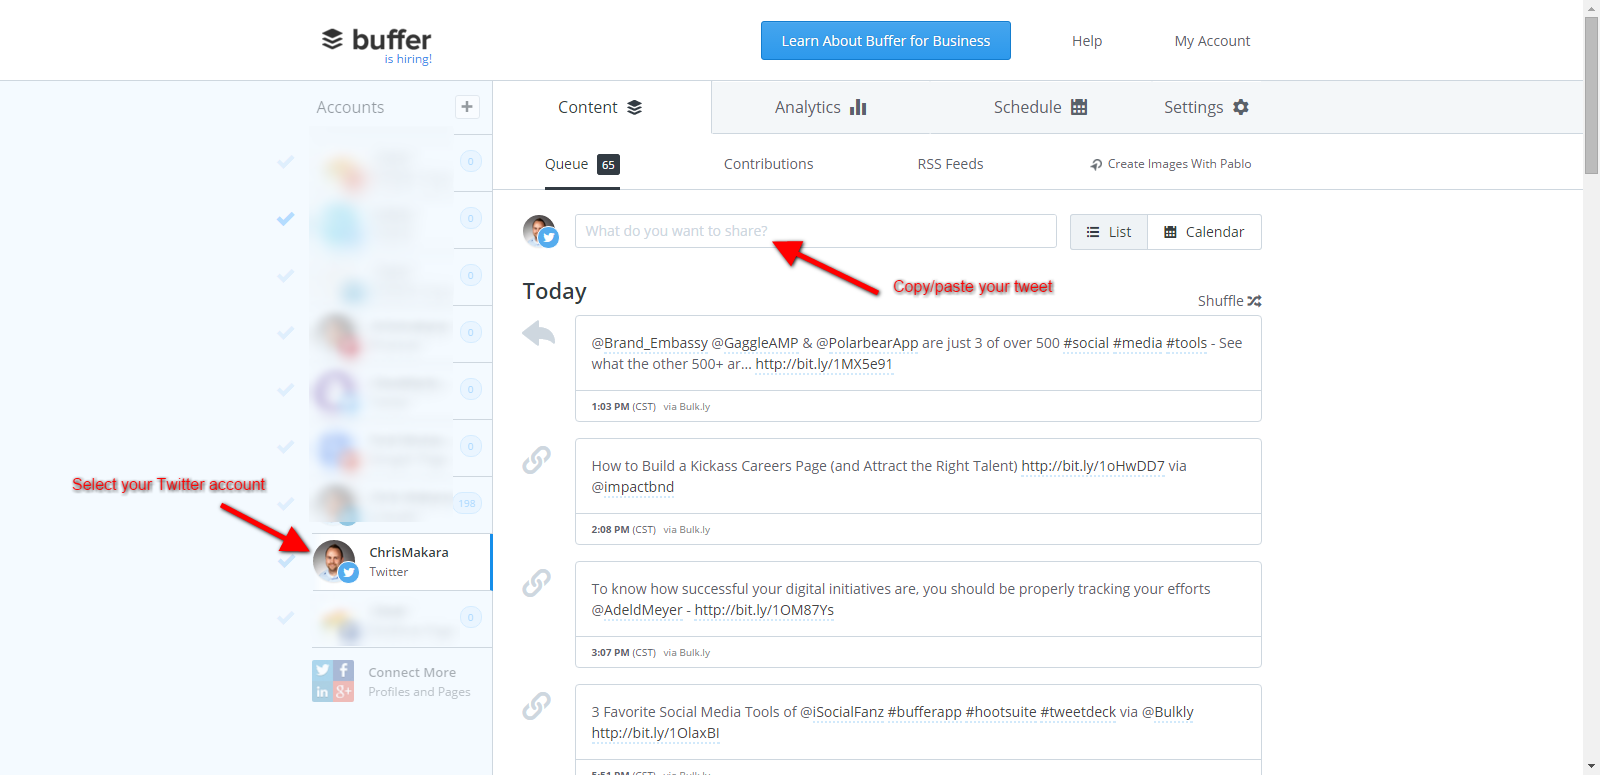
Buffer is another social media tool that has a primary focus around scheduling Twitter updates. If you would like to use Buffer to schedule your tweets, unfortunately it is a manual process. To add your tweets for testing to Buffer, you will need to first select your Twitter account to test with and then click on the text input box to create your tweet.
To make the copying/pasting easier using the Excel file you created above, you will want to use this formula in cell D2:
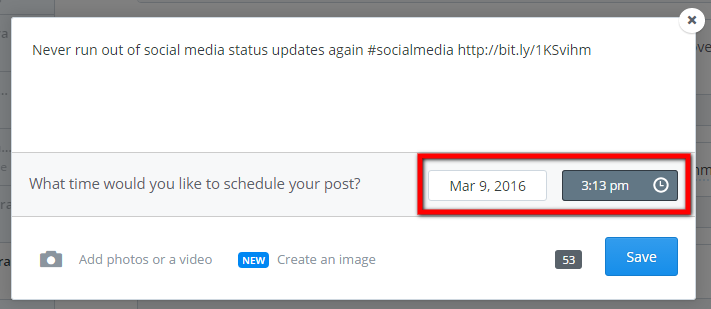
You can then drag (or copy) down this formula to the end of your list of tweets. When you are ready to add them to Buffer, simply copy the text from Column D and paste that into Buffer when you create your tweets. The tweets you add to Buffer will automatically be slotted into the next available time you have setup. You can easily drag a tweet to move it up or down in your queue. Additionally, if you want to create a custom time to post the tweet this can be done by hovering over the tweet and clicking the “edit” link. Next, click on the date to select a particular date. If you want to set a custom time outside of your default schedule, simply click on the “custom time” link and enter the time you want to tweet this post. Be sure to save your tweet!=CONCATENATE(A2," ",B2)
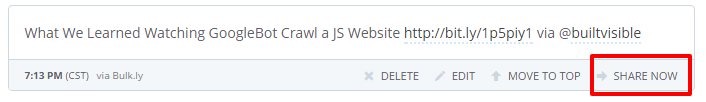
If you want to post the tweet right away, you can hover over the tweet and click “share now.” This will send your post to your Twitter account immediately.
Should you want to simply upload a CSV to populate your tweets automatically, there is a way to do it.
Use a CSV File to Upload Tweets for Testing with Buffer
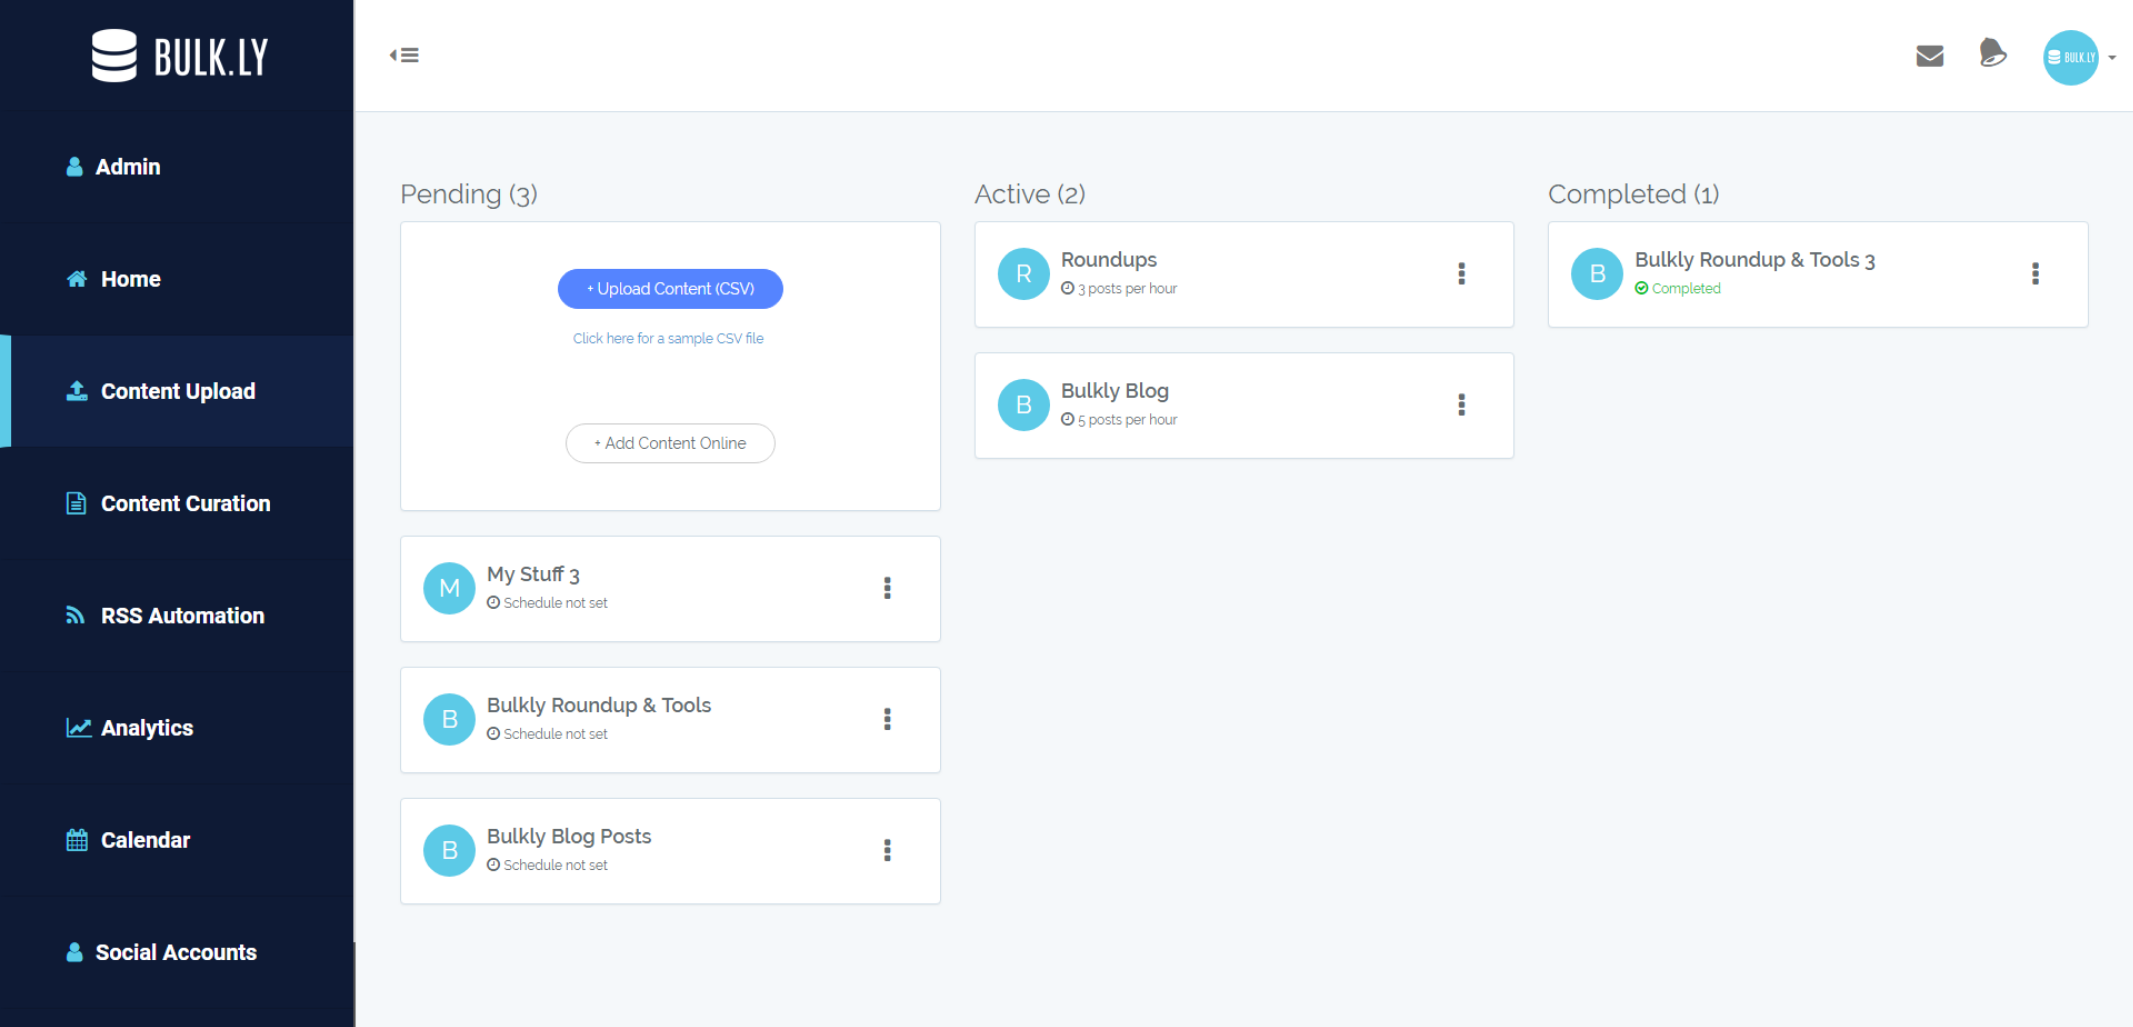
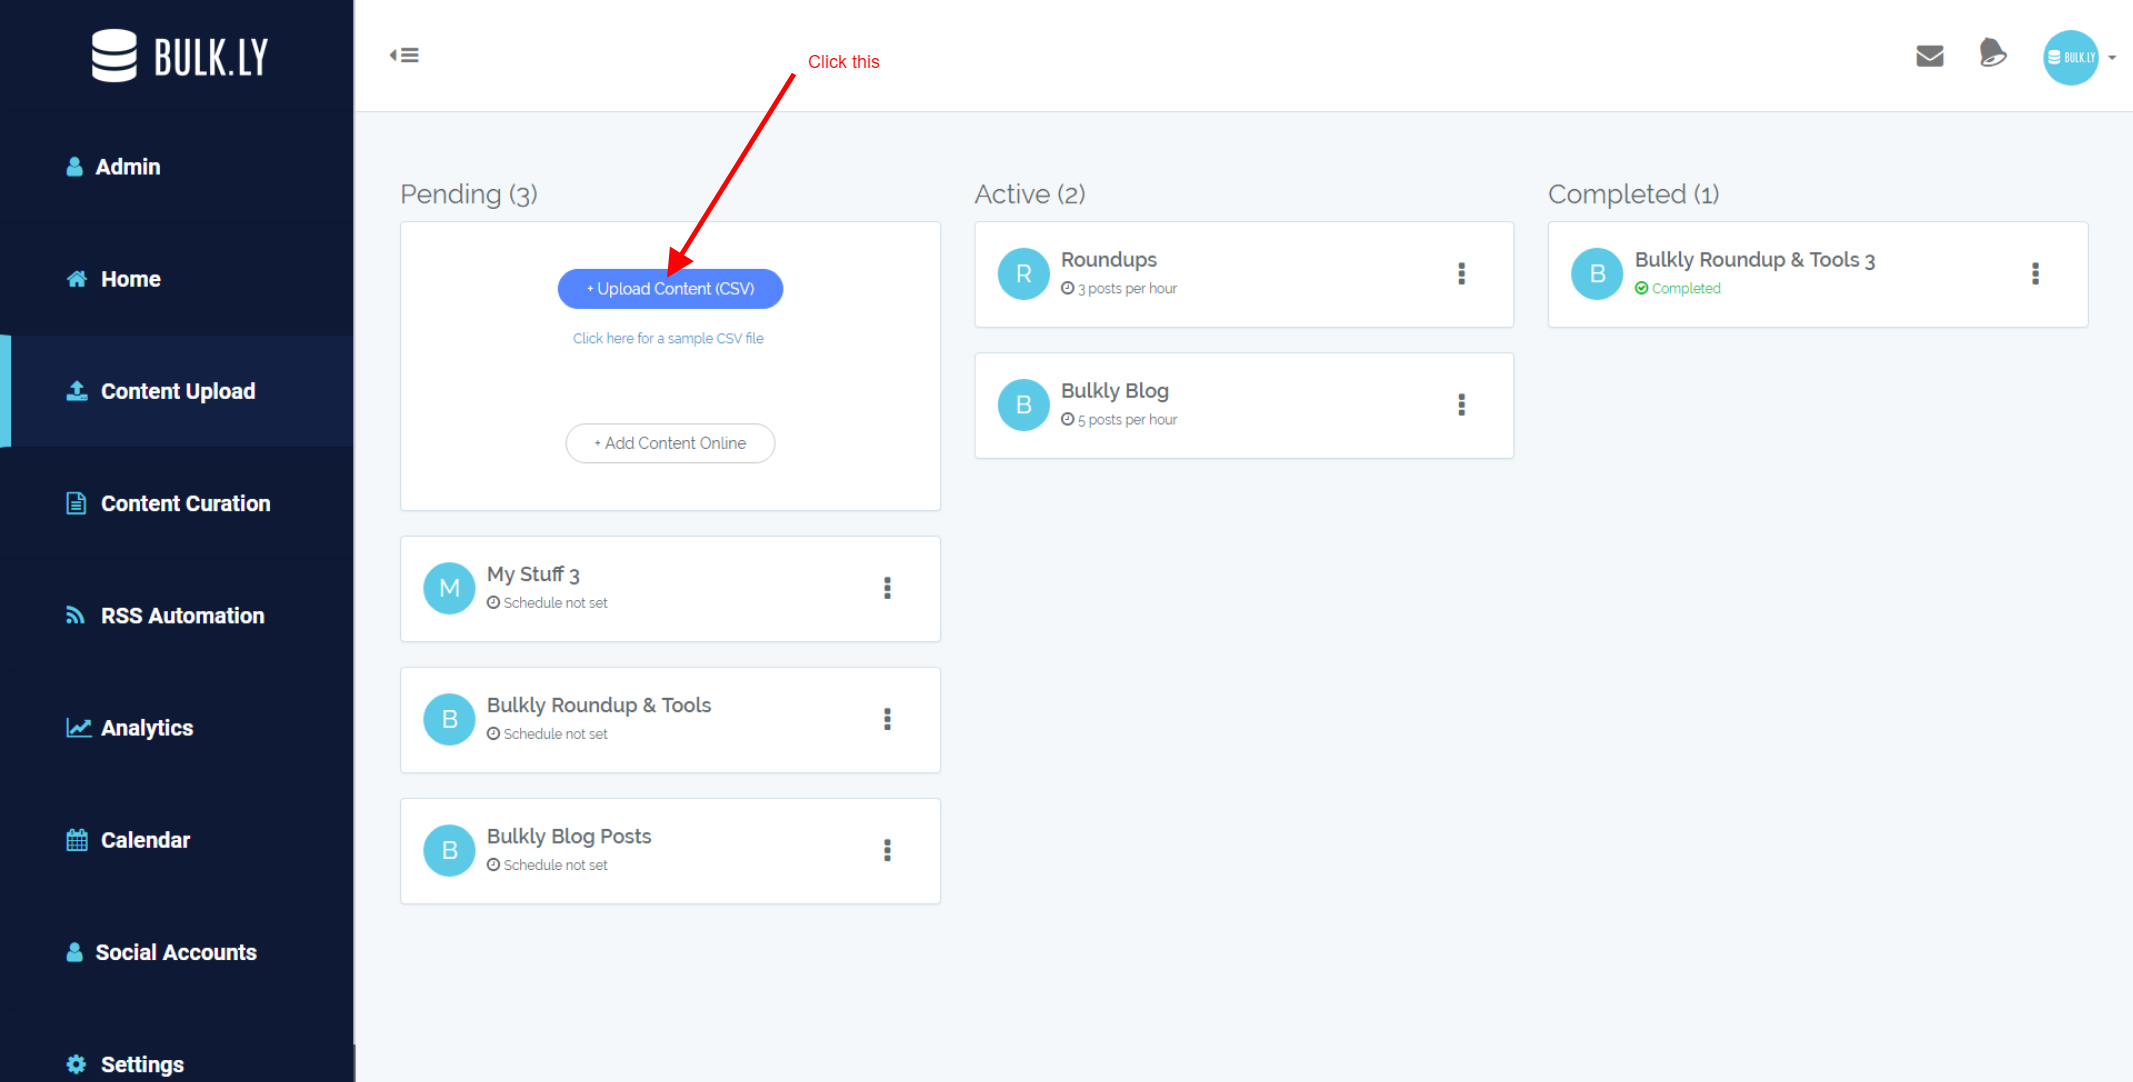
One of the nice things about Hootsuite is that you can upload a CSV with your tweets. With Buffer, it’s not an option. However, I’ll show you how to upload a CSV to Buffer. In order to upload a CSV to Buffer we are going to do it with the help of a site, Bulkly – full disclosure, I created Bulkly and it is currently in beta. The first thing you will want to do is create an account and connect your Buffer account. Once you have granted access to Buffer, all of your social media accounts in Buffer will show up in Bulkly. Bulkly will send updates to your Buffer account for you. Bulkly offers a handful of options to load up your Buffer account, but for this post we are going to focus on the “Content Upload” option. Unlike Hootsuite, Bulkly will allow you to group together social media updates.
Notice the pending, active, and completed columns that each have groups of updates within them.
It makes it very easy to stay organized.
And this comes in very handy if you are going to want to post these updates again and again in order to get more exposure and data. Additionally, it allows you to keep these updates separate from any other updates you have grouped in Bulkly which will allow you to set more or less frequent sending to Buffer. When you are finished running your Twitter test, there won’t be any need to sift through hundreds of scheduled updates to remove only a few – you just have to delete the group or drag it over to the "Completed" column.
One thing to note about Bulkly is that it currently uses your posting schedule as it is setup in Buffer. This means that when a tweet is sent to Buffer, it will be added to the next available spot in your Buffer queue.
Before we get started, we’ll need to tweak the Excel file to work with Bulkly. If you aren’t interested in messing with a CSV, you can easily create your tweets online instead. Click here to see how.
In order to group your tweets in the CSV, you will need to format it like this:
- Column A (URL) – This is the URL you want the tweet to link to
- Column B (Image URL) – Enter the URL (optional) of an image you want to attach to the tweet
- Column C (Content) – In this column you will enter the text of your social media update
Browse for your file. Once uploaded you will be directed to your “Pending” queue. This will show the posts you have uploaded, but not actually scheduled.
From here you can edit and of the items you uploaded. When you are ready, you’ll need to select the Twitter account(s) you want to send these updates to as well as how often you want to send them to Buffer. Click on the “Activate” button to move everything in this group to the “Active” queue.
Within a few hours your tweets will be dripped into your selected Twitter accounts at the intervals you selected.
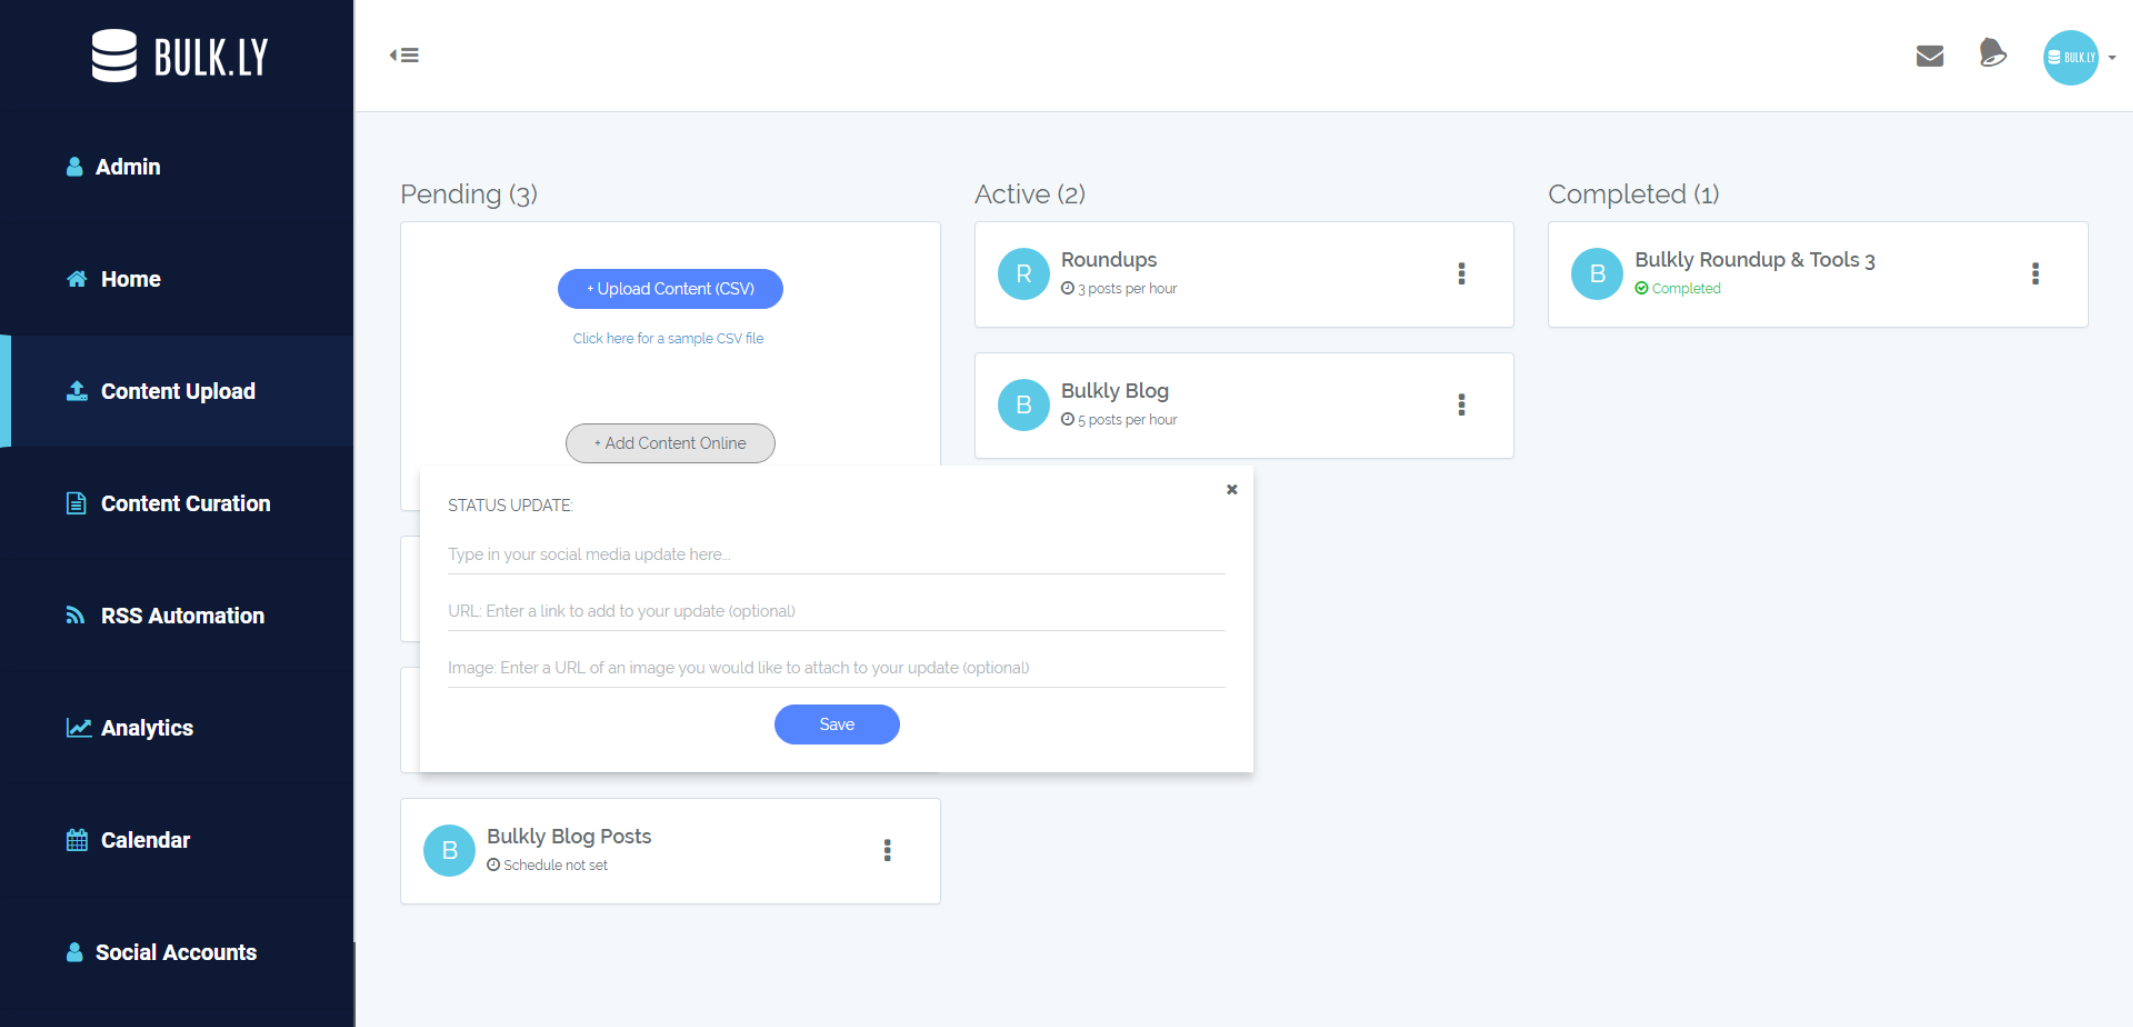
Create Social Updates Without a CSV
Now if the whole CSV talk was a little much, Bulkly gives you the option to simply create the tweets directly on the site. From your “Content Upload” screen, click on the “Add Content Online” button and enter the data through the interface.
Once you have entered your tweets, be sure to activate your group to start sending to Buffer.
Getting Your Tweet Analytics
Once your tweets have been posted a handful of times, you can start to export your Twitter data. To do this, we will be using the Twitter Analytics account you previously set up. Go to your Twitter Analytics account and click on the “Tweets” tab at the top:
In your tweets tab, by default you will see your last 28 days of tweet activities. This date range can be changed to show a maximum of 90 days’ worth of data starting from when you first setup your Twitter Analytics account.
This page is full of key data for your tweets. Among the data displayed are impressions, engagement rate, link clicks, retweets, likes, and replies. All of this data is shown in the right sidebar.
The meat of the page displays your most recent tweets of the date range. It will show you the tweet, impressions, engagements, and engagement rate. Twitter defines engagement rate as:
“Total number of times a user has interacted with a Tweet. This includes all clicks anywhere on the Tweet (including hashtags, links, avatar, username, and Tweet expansion), retweets, replies, follows and likes.”Engagement rate is calculated by taking the number of engagements and dividing it by the total impressions. Your most recent tweets can be toggled using the “Tweets”, “Top Tweets”, “Tweets and Replies”, and “Promoted” tabs. This easily allows you to segment your tweets at a quick glance.
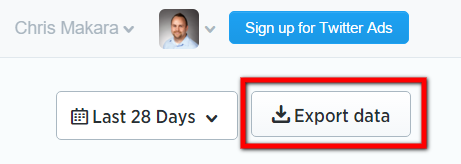
Exporting Your Twitter Analytics
In order to know how your various tweets used for testing performed, we need to export your tweet data out of Twitter. Luckily, this is a very easy process. Just click on the “Export Data” tab and wait for it to download.
As I mentioned, you can export up to 90 days of data at a time. So if your Twitter testing has lasted longer than 3 months, you can set the date range to be sure you download all the data. You will just need to combine the data into a single Excel file to get the whole picture of your tests.
After you have downloaded all your data, it’s time to move on to the fun part – manipulating the data to see what does or doesn’t work.
Analyzing Your Tweet Analytics with Excel
Raise your hand if you just cringed at the sight of using Excel. Don’t worry, I won’t bore you with all the intricacies of how I did this – just some of the key components that make this possible. But before we go any further, you’ll need to download the “ready to go” spreadsheet for analyzing your Twitter A/B testing data. Normally, I like to provide everything you need to know in the blog post, but there are various behind the scenes items going on to make this all work. You can try building this out yourself as detailed below, but it’s probably best to skip the headache and grab my working file.Download My Ready-To-Go Excel File - Click here to download my Microsoft Excel file so you can easily view your tweet analytics.
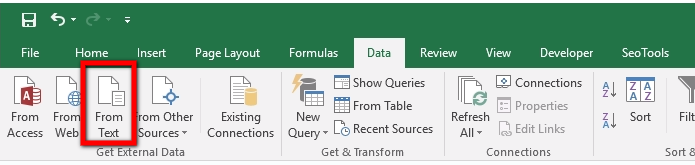
Your Twitter Export
The first thing you will need to do is open your exported Twitter file. Sometimes, just clicking on the downloaded file will automatically open correctly and import all the data. Should this not be the case, you can manually import the data in a few steps. The first thing you need to do is click on the “Data” tab and then on the “From Text” icon.
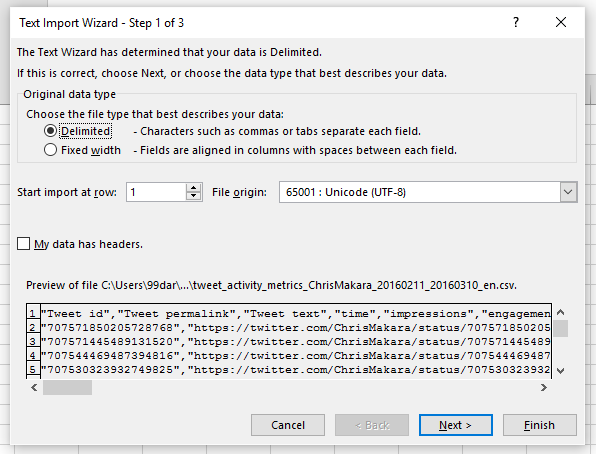
Next, you will be asked to find the file you want to import. In this case, you will need to find your exported Twitter file. After, you select the file location a wizard will load (nope, it’s not Gandalf).
Step 1 of the wizard is asking you what is the data type for this file. You will need to have the “deliminated” radio button selected and then click “next.”
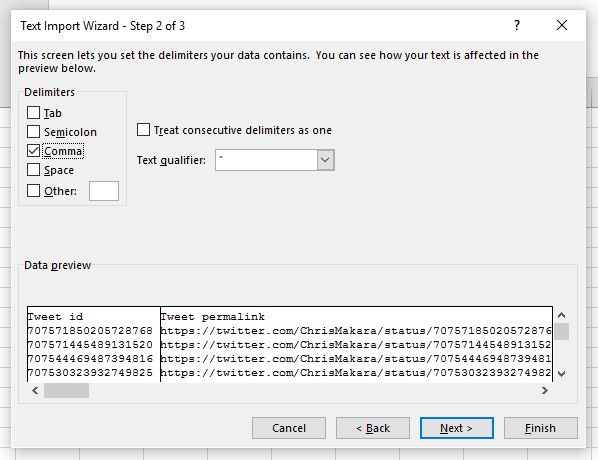
For step 2 of the wizard, you need to indicate the delimiters of the file. In this case, the file is delineated by commas. Uncheck all boxes and have the box selected for comma. You will know it is working when your rows of data become organized into columns. Click next.
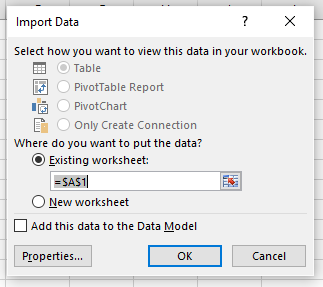
The final step is to tell Excel where you want to insert this data. You should be placing it in an empty sheet so you can click in cell A1 and then click “ok.”
All of the data from your Twitter export will be added to the spreadsheet. If you exported multiple date ranges from Twitter, just repeat this same process. However, you can insert the data at the end of the data you already imported. Just be sure to remove the row containing the header info for each set of data you import.
Once all your data has been imported, rename your Excel tab as “Raw Twitter Data” and save as an Excel file (not a CSV).
If you want to try building this out yourself, or are just interested as to what is happening in the file keep reading. Not interested in this kind of stuff, I won’t judge – you can click here to get to the part of reading the data.
Add Helper Columns To Help With Data Manipulation
Unfortunately, in order to really segment the data we need to add some “helper” columns in our Excel file. These will have various formulas and formatting. Before we add these new columns, you need to create a table of the data you already have. The easiest way to do this is to click “Control + T” inside of the data. This will bring up a dialog box asking what data you want in the table. It should auto select all your columns and rows. Be sure to have the box checked for having a header row and click “ok.” Once your table is created, you can easily create the additional helper columns. These columns will need to be created in the first available column to the right of your table. The benefit of creating a table out of your data is that it will automatically copy down and formatting or formulas you create in the new columns. So let’s add some helper columns.Column AO
The first column you will need to add is called “Short URL” (type the name in cell AO1). The purpose of this column is to extract any URL that was in the tweet. To extract the URL, you will need to use the following formula in cell AO2:
=IFERROR(MID(C2,FIND("http",C2),IFERROR(FIND(" ",C2,FIND("http",C2))-1,LEN(C2))-FIND("http",C2)+1),"")
Once entered, you will see the shortened URL from the tweet if there is one. The table you created should have automatically copied itself to the last row of your data.
Column AP
This column will be used to unshorten the shortened URLs. The reason we need to do this is that you will have different shortened URLs for each tweet. When we are building out our pivot table later, having a bunch of different URLs will make it impossible to group the data together. Therefore, you will need to add this module to your Excel file. Here’s how to do it:- Click on the “Developers” tab in Excel. Not seeing the tab, here’s how to add it.
- In the “Developers” tab, click on the “Visual Basic” icon
- Once the Visual Basic editor is open, click on “Insert > Module”
- Paste this code into the editor:
Public Function unshorten(url As String) As String

Static oRequest As Object

Set oRequest = CreateObject("WinHTTP.WinHTTPRequest.5.1")

With oRequest

.option(6) = True

.option(12) = True

.Open "HEAD", url, False

.send

unshorten = .option(1)

End With

End Function
- Click “File > Save”. You will be prompted to save the file as a macro enabled workbook. Click on “no” in the pop up
- When the “save as” box pops up, select the file type as “Excel Macro-Enabled Workbook”
Please note that if you renamed your table, you will need to change it in this formula. Otherwise, the table you created should be named this already. Once entered, this column will unshorten your URLs. Please note that depending on how many rows of data you have, it can take quite a while to unshorten. For example, it took close to 2 hours to unshorten about 6,000 rows of data. If you have thousands of rows of data, I would let the URLs unshorten. Once completed I would copy the column and paste the values directly on top of the formula for this column. The reason being is that when you add the additional columns below, Excel will try to recalculate the formulas again depending on your settings. By having just values for the unshortened URLs, Excel won’t have anything to recalculate.=IFERROR(unshorten(Table1[@[Short URL]]),"")
Column AQ
Depending on how you track your social media analytics you may have query parameters on your URLs. This column serves as a way to remove those parameters so that you are left with a clean URL. For example, instead of having a URL like: Your clean URL will look like this: Here’s the formula you need to put in cell AQ2:
=IFERROR(LEFT(AP2,FIND("?",AP2&" ")-1),Table1[@[Unshort URL]])
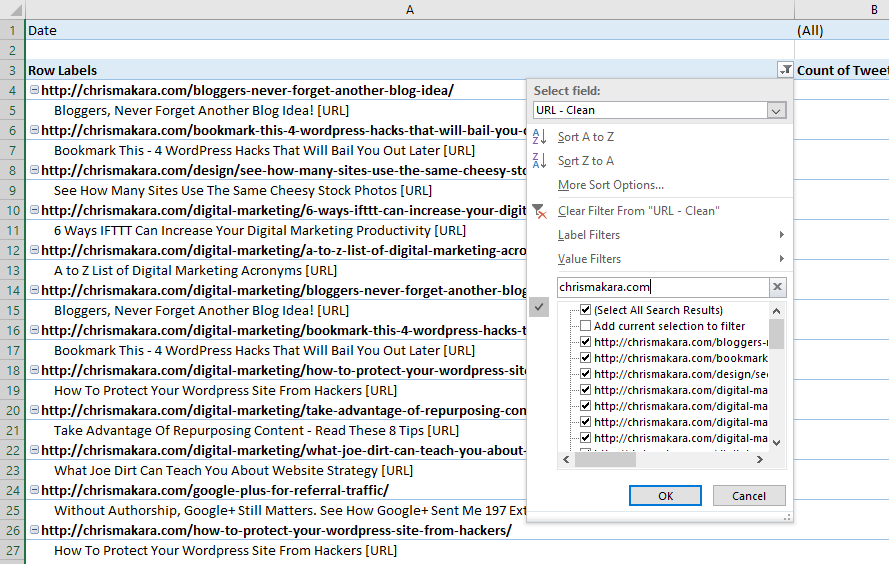
You’ll need to name the column as “URL – Clean”. This will allow you to easily group your tweets by URL in the pivot table we will be creating later.
Column AR
The next column we need to create is one that will remove the URL from the tweet, leaving us with just the text of the tweet. Create a new column and in cell AR1 name it “Tweet No URL”. Then in cell AR2, enter this formula:
=IFERROR(TRIM(SUBSTITUTE(C2,MID(C2,FIND("http",C2),IFERROR(FIND(" ",C2,FIND("http",C2))-1,LEN(C2))-FIND("http",C2)+1),"[URL]")),"")
What this will do is remove the URL from the tweet and replace it with “[URL]”. For example, if the tweet originally was:
- 21 Ideas For Evergreen Social Media Content Updates https://t.co/FRVaIsPe0y
- 21 Ideas For Evergreen Social Media Content Updates [URL]
Column AS
Similar to the column above, this will remove the second URL (if there is one) from your tweet. In cell AS1, name it “Tweet No URLs” and then use this formula in cell AS2:
=TRIM(IFERROR(SUBSTITUTE(AR2,MID(AR2,FIND("http",AR2),IFERROR(FIND(" ",AR2,FIND("http",AR2))-1,LEN(AR2))-FIND("http",AR2)+1),"[URL]"),Table1[@[Tweet No URL]]))
This formula will take your tweet from looking like this:
- 21 Ideas For Evergreen Social Media Content Updates [URL] https://t.co/FRVaIsPe0y
- 21 Ideas For Evergreen Social Media Content Updates [URL] [URL]
Column AT
Next up is getting the date formatting to work. When you export your data from Twitter, it’s exported as something like this:- 2016-03-09 14:20 +0000
=(IFERROR(DATEVALUE(LEFT(TRIM(TEXT(D2,"yyyyy-mm-dd hh:mm:ss")),FIND(" +0000",TRIM(TEXT(D2,"yyyyy-mm-dd hh:mm:ss"))&" ")-1)),""))*1
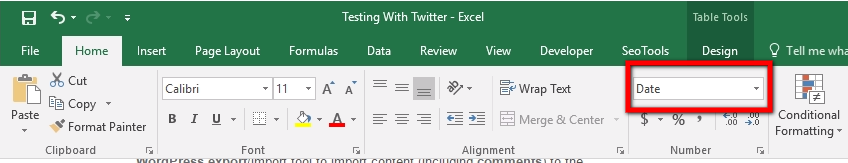
You will need to change the format of the column from “General” to “Short Date.” To do this, highlight Column AT and then in your “Home” tab of Excel, select “Short Date” from the dropdown.
This will magically create normal looking dates for your tweets. For example:
- 03-09-2016
Download My Ready-To-Go Excel File - Click here to download my Microsoft Excel file so you can easily view your tweet analytics.
Create a Pivot Table to See Your Twitter Test Results
Once you have created your helper columns, you can get to the good stuff which is viewing your results. Since you have already created a table, the next step is to create a pivot table with your data. I know what you are thinking, “A pivot table? I have no idea what that is!” No worries, it’s really easy. On your “Raw Twitter Data” tab, click anywhere inside your table. This will activate the “Table Tools” ribbon in Excel. In this ribbon, you will need to click on the icon that says “Summarize With Pivot Table.” A dialog box will popup asking you where do you want to create this table. Just click “ok” and it will create a new tab for the table. On this tab you will see the “Pivot Table Fields” menu. In order to build out your table of Twitter testing results, you will need to drag/drop the pivot table fields to the following areas in this order:Filters
- Date
Rows
- URL – Clean
- Tweet No URLs
Values
- Tweet No URLs
- Impressions
- Retweets
- Replies
- Likes
- URL Clicks
- Engagement Rate
This will now count all the cells with data in a row with data for this field.
Following the same process, you need to change the “Value Field Settings” for the “Engagement Rate” to summarize the value field by “Average.” This will show an average engagement for each tweet.
Another thing you might want to do for your “Engagement Rate” column is to change the format of the column to show as a percentage. To do this, highlight the whole column and then right-click and select “format cells.” Then click on “percentage” and change the decimals to two places and click “ok.”
Reviewing Your Twitter Testing Data
Your pivot table is now ready to go. However, you will notice that there are probably a lot of tweets that you aren’t interested in. For example,- Tweets to sites that are not yours
- @ Replies
- Generic text that could be a quote, thought, complaint, etc. – something you aren’t probably testing
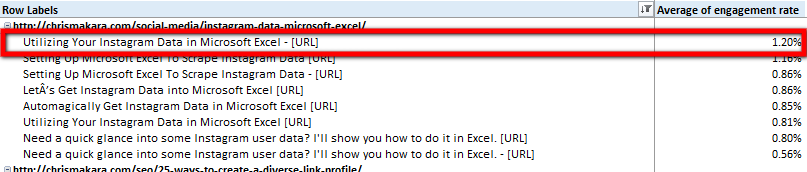
Your filtered results will show you the URL(s) tweeted for that domain and the different tweets that were sent linking to that URL.
Viewing the columns to the right, you will be able to see the different type of engagement that specific tweet text generated. You will need to determine what your main KPI is.
Typically, I put more weight onto the average engagement rate in that I am looking to create social updates that drive more overall engagement.
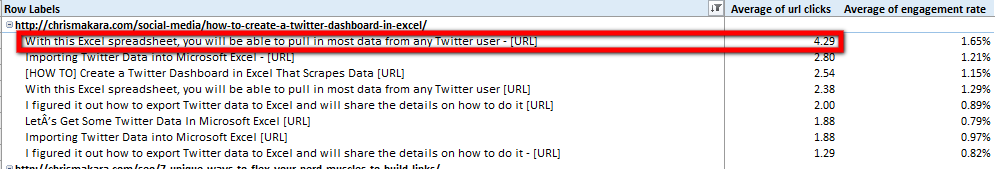
On occasion, I am more interested in driving clicks to a URL so I will look at the URL clicks. However, instead of showing the sum (total) clicks to a URL, I change the column to show the average clicks for the social media update.
The beauty of this report is that it is pretty flexible. You can tweak it to show the data you want. You will notice that Twitter exports quite a bit of data which will allow you to manipulate it to your needs.
Some additional data you might be interested for your tweets are:
- Which tweets generated the most hashtag clicks?
- What are the average impressions per tweet?
Determining Statistical Significance For A/B Testing
There will be quite a few variables involved in regards to how long it will take you to reach a statistical significance with your results. Among these variables are:- Twitter audience/reach
- Typical engagement of your audience
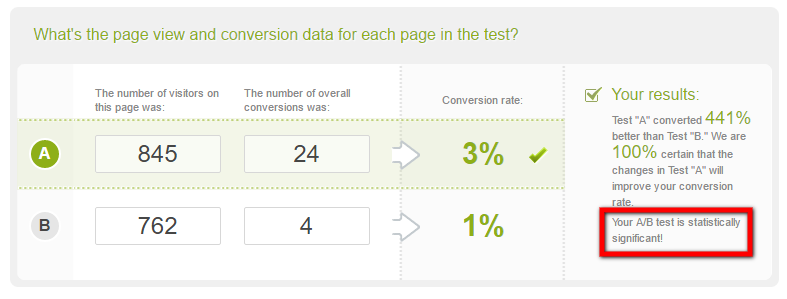
Once you plug in your numbers, this nifty tool will tell you if your results are statistically significant.
Even if your results are not statistically significant, chances are you can tell when something is a dud or not.
For most, the way you will be able to get to statistical significance is to be sure to post your tweets multiple times to increase the overall impressions of each.
Typically, my tests are not necessarily time sensitive in that the majority of my posts are evergreen in nature. This makes it easy to run my test tweets for an extended time.
Everyone’s situation will be different in regards to how long or how many times you should tweet your tests. I would say a good start is at least 10 times or so. However, it might be best to spot check your Twitter Analytics every few days to see how things are going.
Make Adjustments & Test Again
As I mentioned at the beginning of this post, I am always testing. And you should be too. Once you have run your initial tests, no matter what they may be, you should look at ways to improve upon what you found that works. For example, let’s say you identified a tweet that generated the best engagement rate among the group. Why not test that against the same tweet, but with an image attached? See how that impacts your engagement rate. Perhaps you didn’t get enough impressions for some of the tweets you were testing. Next time, schedule them more frequently during times that your Twitter audience is most active. The key is to always look at ways to improve your results each time you test. Will it always improve? Probably not. But you won’t know until you test it. Whether you are testing blog content titles or generating more clicks to your Chrome Extension (get Analytics for Chrome Extensions) - testing can have a dramatic impact on your efforts. Best of all, being able to run tests like this are a great way to set yourself apart from others when looking for freelance gigs. Be sure to grab the Excel file for Twitter testing if you haven't already. Also, let me know in the comments how you plan to use this approach.Download My Ready-To-Go Excel File - Click here to download my Microsoft Excel file so you can easily view your tweet analytics.
Nancy Seeger March 30, 2016
Great post Chris. You emailed me a link after “listening” for a tweet I made that pertained, and it worked. I am here and interested in your updates. Great job.
Chris Makara March 31, 2016
Great to hear that I was able to catch your interest 🙂 Thanks for reading and taking the time to comment. Have a good one!
Philip Verghese Ariel May 15, 2016
Hi Chris.
What a joy to be here today,
This is indeed an informative pack!
Lot of information, analytical data packed in!
Great inform to me, I am book marking it for my further test!
You did a great homework here Chris
Will come back again to read more such stuff here
Keep sharing.
May you have a great week ahead.
Best Regards
~ Philip
@PVAriel
Chris Makara May 16, 2016
Glad you enjoyed the post, thanks for taking the time to leave a comment!
Saurav Kumar Nayak June 20, 2016
Hi Chris,
It was worthy reading your post.
I did not know that twitter can be used to split test and even multivariate test.
If you want your website to perform better and yield better profit then you must the power of social media to improve it. Twitter is surely an effective tool to draw more traffic into your website but there are tons of tweets daily. So you have to choose a best tweet so that it is within limit yet it looks attractive.
Twitter analytics is surely a great tip which I did not know this much better.
Thanks for sharing your great idea with us.
With regards,
Saurav
Chris Makara June 21, 2016
Glad you enjoyed the post Saurav…yes, Twitter Analytics can definitely help you find the best performing tweets through testing. Glad you learned something new 🙂
Chris Makara June 7, 2017
Thanks for the reply Saurav! Twitter is definitely a great platform to run some tests by looking into your Twitter analytics data. I’m glad you found this approach useful 🙂
John Martin June 23, 2016
Great post, Chris! Love this detailed step-by-step how-to with pictures. Especially about creating a pivot table in Excel to analyze the results. I’ve managed several clients’ social accounts for a while, and they’re interested in traffic. I’d like to A/B test to see the effects of (1) number of hashtags and (2) time of post…even with my own Twitter account. Maybe a little more challenging to test, since I’m using Tweet Jukebox. But will see if I can find a way to try these.
Thanks again!
-John
Chris Makara June 24, 2016
I did a hashtag test awhile back using Twitter Analytics. It wasn’t easy, but I was able to find the top engaging hashtags as well as least engaging. I did not try to find whether 1 or two hashtags made a difference, but I am sure I could figure it out when I get some time.
Marty June 24, 2016
Great analysis and share, thanks for all the knowledge. Its really interesting to see that Twitter has so much for us to build our online presence and generate traffic for our website.
Chris Makara June 24, 2016
Definitely Marty! They definitely give you quite a bit of data but it is up to us to dissect and analyze it 🙂
Nail Dunn January 7, 2017
I have never seen such kind of analysis on tweeter’s tweet analytics. It’s sure, my knowledge base increased a lot. What a great knowledgeable person, Chris is……..
Shantanu Sinha June 7, 2017
Hello Chris,
One of the most effective ways for analyzing our tweets.
I have been doing this from a period of time and the results are very satisfying.
The information provided by your side is so in-depth that it can easily turn the readers the view towards the
social media. The steps by your side and the pictures just cleared all the doubts over, which were going inside my
mind.
Thanks for the share.
Shantanu.
Andrew M. Warner July 9, 2017
Hey Chris,
Great post. First off, just wanted to make you aware of a grammatical error in your first sentence.
You wrote: “You are probably familiar with the acronym ABC with is short for “always be closing.” But after ABC it should be “which” and not “with”
Anyhow, like I said, great stuff. I’ve been testing various tweets for the last few months (not as much as I should … and definitely not to degree you laid out here) but when I did, I’ve had some great results. And it’s something I should be doing more of actually.
I’m going to try this out .. especially with exporting to Excel (which I’m not too good at).
– Andrew
Chris Makara July 11, 2017
Hey Andrew, thanks for the heads up…I fixed that sentence 🙂
Yeah, this method works pretty good if you have a decent following/engaged audience. Getting it in Excel can be tricky if you don’t use Excel that much, but I tried to explain it the best I could. If you get stuck, let me know 🙂
Emmerey Rose July 12, 2017
Awesome post Chris! I’ve never seen such a thorough guide about tweet analytics. You did a pretty good job. Lots of meat in here. I was wondering, is Twitter Analytics a free tool? what other tool can you recommend for this?
Chris Makara July 12, 2017
Thanks! Yes – Twitter Analytics is a free tool. I don’t have any other recommendations since this is free…and it’s hard to beat free!
Emmerey Rose July 14, 2017
haha yeah, it’s always great when it’s free. Thanks Chris for responding! 🙂
Filip Zafirovski October 11, 2017
Great analysis Chris.
Do you think at this point is much smarter to invest more time on Instagram than Twitter?
Kind regards,
Filip
Chris Makara October 12, 2017
I think it really comes down to where your target audience is at and what your ultimate goal(s) are from being on social media. For some it might be Twitter and for others it could be Instagram.
Mudassir May 20, 2019
I really enjoyed reading this analysis. With 330 Million audience, Twitter is definitely the platform every Internet marketer should explore. And, this analysis is really worth trying it.
Great post!
Chris Makara May 20, 2019
Glad you enjoyed the post, let me know if you end up implementing/trying it out.
Mudassir May 21, 2019
Hi Chris,
I tried experimenting on the title placement, hashtags, and images. And, I see the variations in the CTA’s and engagement results. Now, I understand that which works best for me, however, I’d like to try some more using Buffer, as per the mention.
I’d like to appreciate you for bringing such a useful article.
Chris Makara May 22, 2019
Glad you were able to see what works best for you. Definitely keep me posted if you end up using Bulkly/Buffer to test further.
Maazia November 21, 2019
Twitter has endless possibilities when it comes to marketing your service/product. The ideas and insights you’ve shared about split testing and multivariate testing is very interesting! I’ll be sure to give all that you’ve mentioned, a solid try! This was a nice read Chris! 🙂
Chris Makara November 22, 2019
Yep, definitely 🙂 There’s so much opportunity to test and market. Glad you enjoyed the post.